Air Quality

Why does it matter?
There are many different pollutants, such as nitrogen oxide and ozone, that affect air quality (and health). One type of pollution that has a strong, negative health impact are particulates. A distinction is made between coarse particles (PM10) and fine particles (PM2.5). A large longitudinal study found a massive effect of particulates on the risk of lung cancer (specifically a 22% increased risk of lung cancer per 10 μg/m3 of PM10, and an 18% increase per 5 μg/m3 of PM2.5). And that doesn’t even include other serious health implications, such as cardiovascular disease.
Air pollution data
Depending on your geographic location, there might actually be quite a lot of openly available information on air quality. For instance, there is the World Air Quality Index project, a non-profit organisation that provides live air quality data from around the world. Their world map contains data from official measurement stations, as well as from citizen science projects. One such citizen science project with a very nice website is sensor.community .
Specifically for Europe, the European Environment Agency has a website with up-to-date air quality data (their colour scaling for the pollutant concentration is a bit dubious; I suppose it would take a volcanic eruption in the centre of Europe to turn the markers to orange or red). The city where I live, Berlin, has a network of measurement stations; the data is also accessible online. You might find Berlin’s website a bit old-fashioned, but the data can be downloaded for further analysis, which is nice.
So, there’s quite a bit of openly available air quality data. But I was asking myself: what’s the air pollution right where I live, in my street, and inside my apartment? And is there anything I can do about it?
Measurement
Measuring particulate concentration is surprisingly easy (and cheap), thanks to the Nova Fitness SDS011 particulate sensor and microcomputers such as the Raspberry Pi. Even the very lightweight and affordable Raspberry Pi Zero is sufficient for this purpose. The code I use for this project is available on GitHub. For more background information have a look here and here.
Action?
Is there anything you can do to improve the air quality inside your home? I decided to buy a Philips AC 2887/10 air filter, and test whether it has an impact on air quality. For about two weeks, I measured the indoor particulate concentration without an active filter, those two weeks are my baseline. Initially I only measured the particulate concentration with a single sensor inside my apartment. For comparison, I downloaded data from an official outdoor measurement station from the above-mentioned website. The below graph shows the PM2.5 concentration inside my apartment (blue line), and the corresponding data from the outdoor measurement station, which is located about two kilometres from my home. The vertical dotted line indicates the time point when the filter was activated (i.e. measurements left of the dotted line are without filter). For display purposes, the graph shows a rolling average (mean over a 24 hours time window).
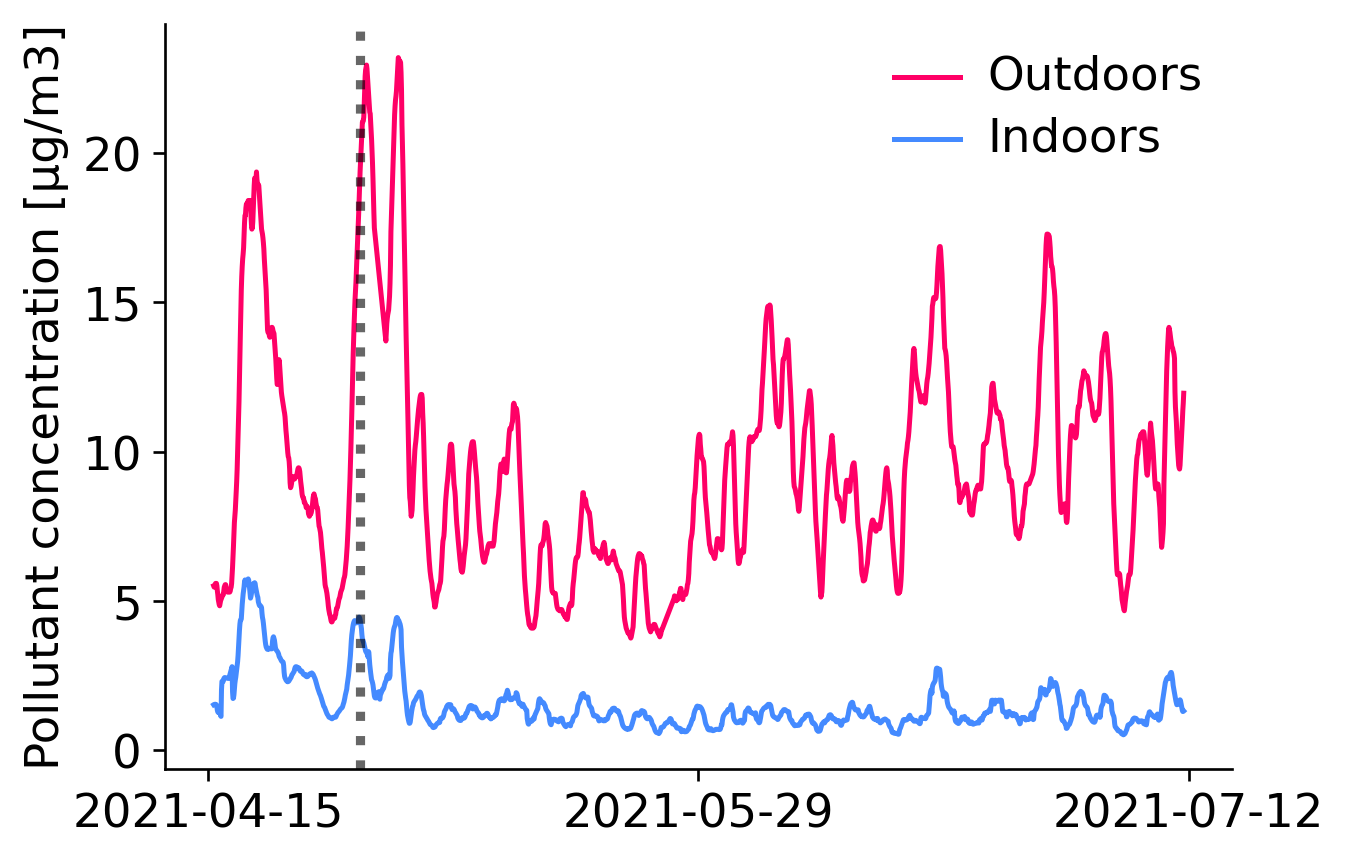
It is immediately apparent that there is a huge variance in the signal. The outdoor PM2.5 particulate concentration exceeded 20 μg/m3 on bad days, but was below 5 μg/m3 on good days. An obvious problem is that the baseline period (without filter) only covers about two weeks, much shorted than the experimental condition (with filter). However, now that I have the filter, I’m not prepared to switch it off again, so we have to work with limited data. Does the filter have an effect? We can’t really tell from the above figure.
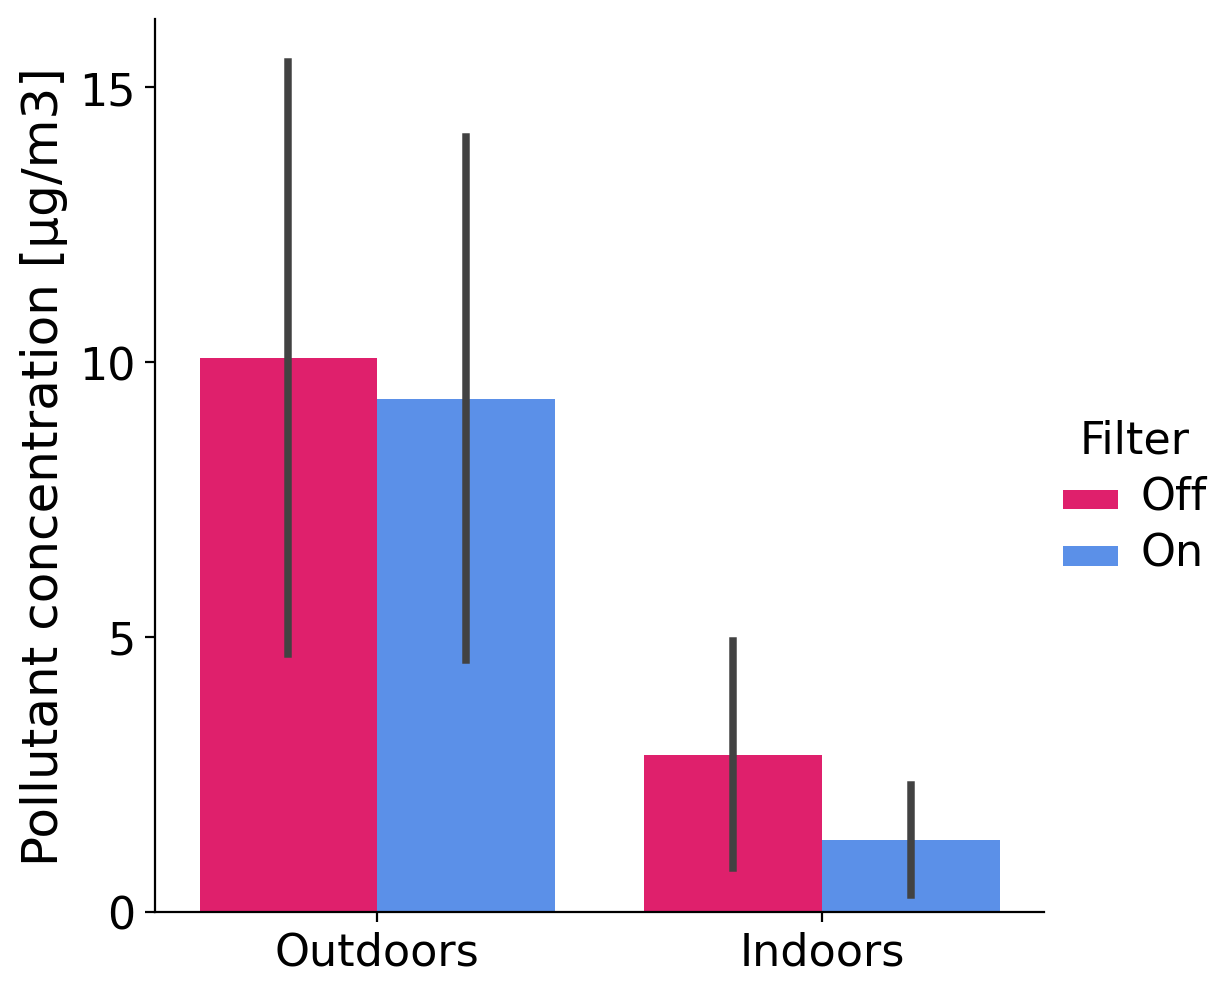
The bar graph below shows the mean PM2.5 particulate concentration separately for outdoors and indoors, with and without filter (the error bars correspond to the standard deviation). The indoor particulate concentration was lower with an active filter, but the outdoor concentration was also slightly lower during that time period, so we can’t (yet) conclude that the filter really had an effect.
There’s no way around it, a statistical model is needed to figure out whether the filter had any effect. A simple linear regression model won’t do the trick, because we’re dealing with a heavily autocorrelated time signal. There are not many days on which I have to resort to a language other than Python (after all, anything from querying a database to deploying a deep learning model in a web application can be done in Python). But when it comes to correlated error terms, well, it’s time for R. I fitted a generalized least squares model with R’s nlme package:
model = gls(
  pm25_internal ~ filter + pm25_external,
  data=df,
  correlation=corCAR1(form=(~timestamp))
  )
This model explains the indoor PM2.5 concentration as a combination of the effect of filter (on / off) and the outside PM2.5 concentration, while accounting for the fact that subsequent measurements are correlated (specifically with a continuous autocorrelation structure of order 1)1. Here are the results:
Coefficients:
                Value   Std.Error   t-value   p-value
(Intercept)     1.584      0.0753    21.036         0
filterTrue     -1.458      0.0636   -22.929         0
pm25_external   0.126      0.0047    26.790         0
As expected, the outdoor particulate concentration has a statistically significant, positive effect on the indoor particulate concentration (in other words, when the outside air pollution is bad, the inside air quality also becomes bad). Moreover, the filter has a statistically significant, negative effect on indoor particulate concentration – the indoor air quality becomes better with an active filter.
Limitations
Because of the relatively short baseline period (about two weeks of measurements without filter), the dataset is imbalanced. It would be interesting to collect more indoor data without filter, but given the evidence in favour of using a filter, I won’t switch off the filter anytime soon.
Another limitation concerns the rather large physical distance between the indoor and outdoor measurement locations (about 2 kilometres). By now, I have placed another sensor (identical to the one used for indoor measurements) outside of my apartment, but that was only after the measurements for the baseline period were taken.
Even taking into account these limitations, the result are sufficiently strong evidence for me to continue the use of an air filter inside my home.
Outdoor measurements
My main goal with this project was to find out whether I could improve the air quality inside my home with an air filter. Especially the sensor placed outside proved to be interesting beyond this initial question. Before starting the measurements with the outdoors sensor, I would have expected high air pollution during the day, particularly during rush hour, and better air quality at night. It turned out that the air pollution can change a lot within a day, but not always quite as expected. Consider, for example, the below graph, which shows the particulate concentration over 24 hours on 13/07/2021:
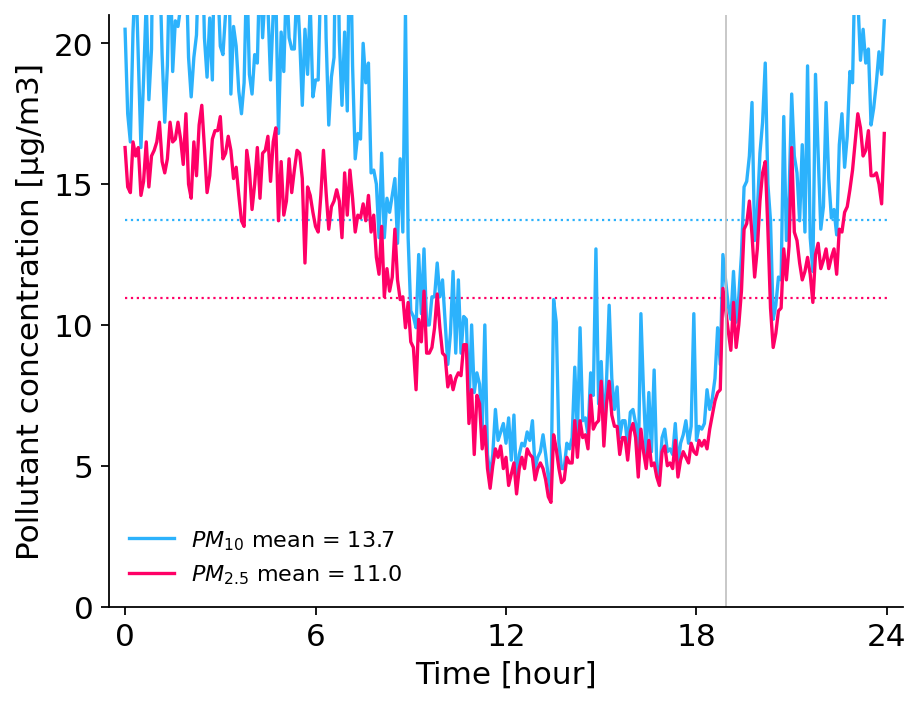
On that night, the air quality was very bad (for Berlin standards), with PM2.5 concentrations well above 15 μg/m3. But much lower values were observed around noon. A variety of factors influence the day-to-day air quality, and besides the actual amount of emissions caused by traffic and other human activity, the weather plays an important role in dispersing pollutants. (For Berlin, there’s some information about this on the municipalities website, and a detailed annual report, both in German though).
I observed the above pattern, with worst air quality at night, and a daily minimum pollutant concentration around noon or in the early afternoon, on several hot summer days. I suppose on such days it might make sense to selectively open windows when the pollution reaches its daily minimum, and perhaps also choose those times for physical exercise, if possible.
The live measurements from my outdoor particulate sensor can be viewed here.
-
pm25_internalandpm25_externalare the indoors and outdoors particulate concentrations, respectively.filteris a boolean variable, whereTruecorresponds to data points where the filter was active, andtimestampis time in seconds since epoch. ↩